Local Websites Provide Real-Time Weather Information
Get Up-to-Date Info When the Big Storm Hits

“The trouble with weather forecasting is that it’s right too often for us to ignore it and wrong too often for us to rely on it.”~Patrick Young
You may not trust our local weather forecasters any more than I do but when a big storm like yesterday’s approaches us, there are a few handy online tools that you can use to get up-to-date information about where it’s raining, how much it’s coming down and whether it is heading your way.
Turns out there are automated weather stations embedded throughout California and more than sixty of them in Santa Barbara County. When the rain begins to kick in, the stations report in every few minutes. Coupled with Google radar, satellite and precipitation layers on some of the sites it is easy to get real-time rainfall information and to visualize what its impact might be.
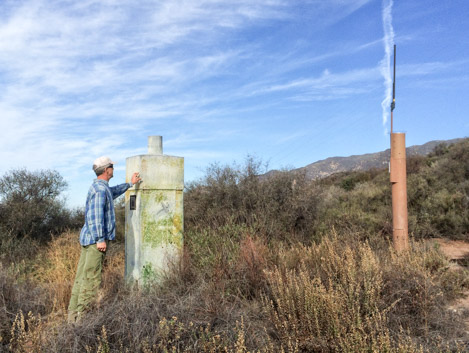
Until a recent trip into the upper Carpinteria foothills I had no clue what the stations looked like or what they did. A handful of us have been spending our Saturdays cutting a route up a steep ridgeline where the historic Franklin Trail once took fishermen, hunters and packers over the mountain crest and into the upper Santa Ynez River watershed. On one of the trips I spotted weird looking tower that seemed totally out of place. “What the heck is that?” I asked to a fellow trail volunteer, Gordon Jenkins, as we drove up to the upper part of the Franklin Trail. “I think that’s one of the County’s weather stations,” he told me. “There’s a really cool website that shows where each of the towers are located. I think that’s the Edison Trail station.”
Before we got to work on the brush clearing needed to re-open the trail, we took a short side trip over to the station. Visually it was pretty disappointing — no moving parts, no noise, nothing to give you the sense it was doing anything. I’d find out later how valuable stations like this can be. “I’ll get you the website information when we get home tonight,” Gordon. “You’ll love the site.”
VC Watershed.Net
The first site that Gordon turned me onto is VCWatershed.Net, a site sponsored by Ventura County. Though it focuses on the Ventura area, it is easy to scroll over to our area to view the weather data here. Amazingly, the site also displays weather stations throughout California, which means you have quick access to rainfall data throughout the state. BTW, while we were getting 2.23 inches of rain in downtown Santa Barbara over the past two days, Death Valley received 1.29” — a huge amount for that area. View the VC Watershed.Net Map.
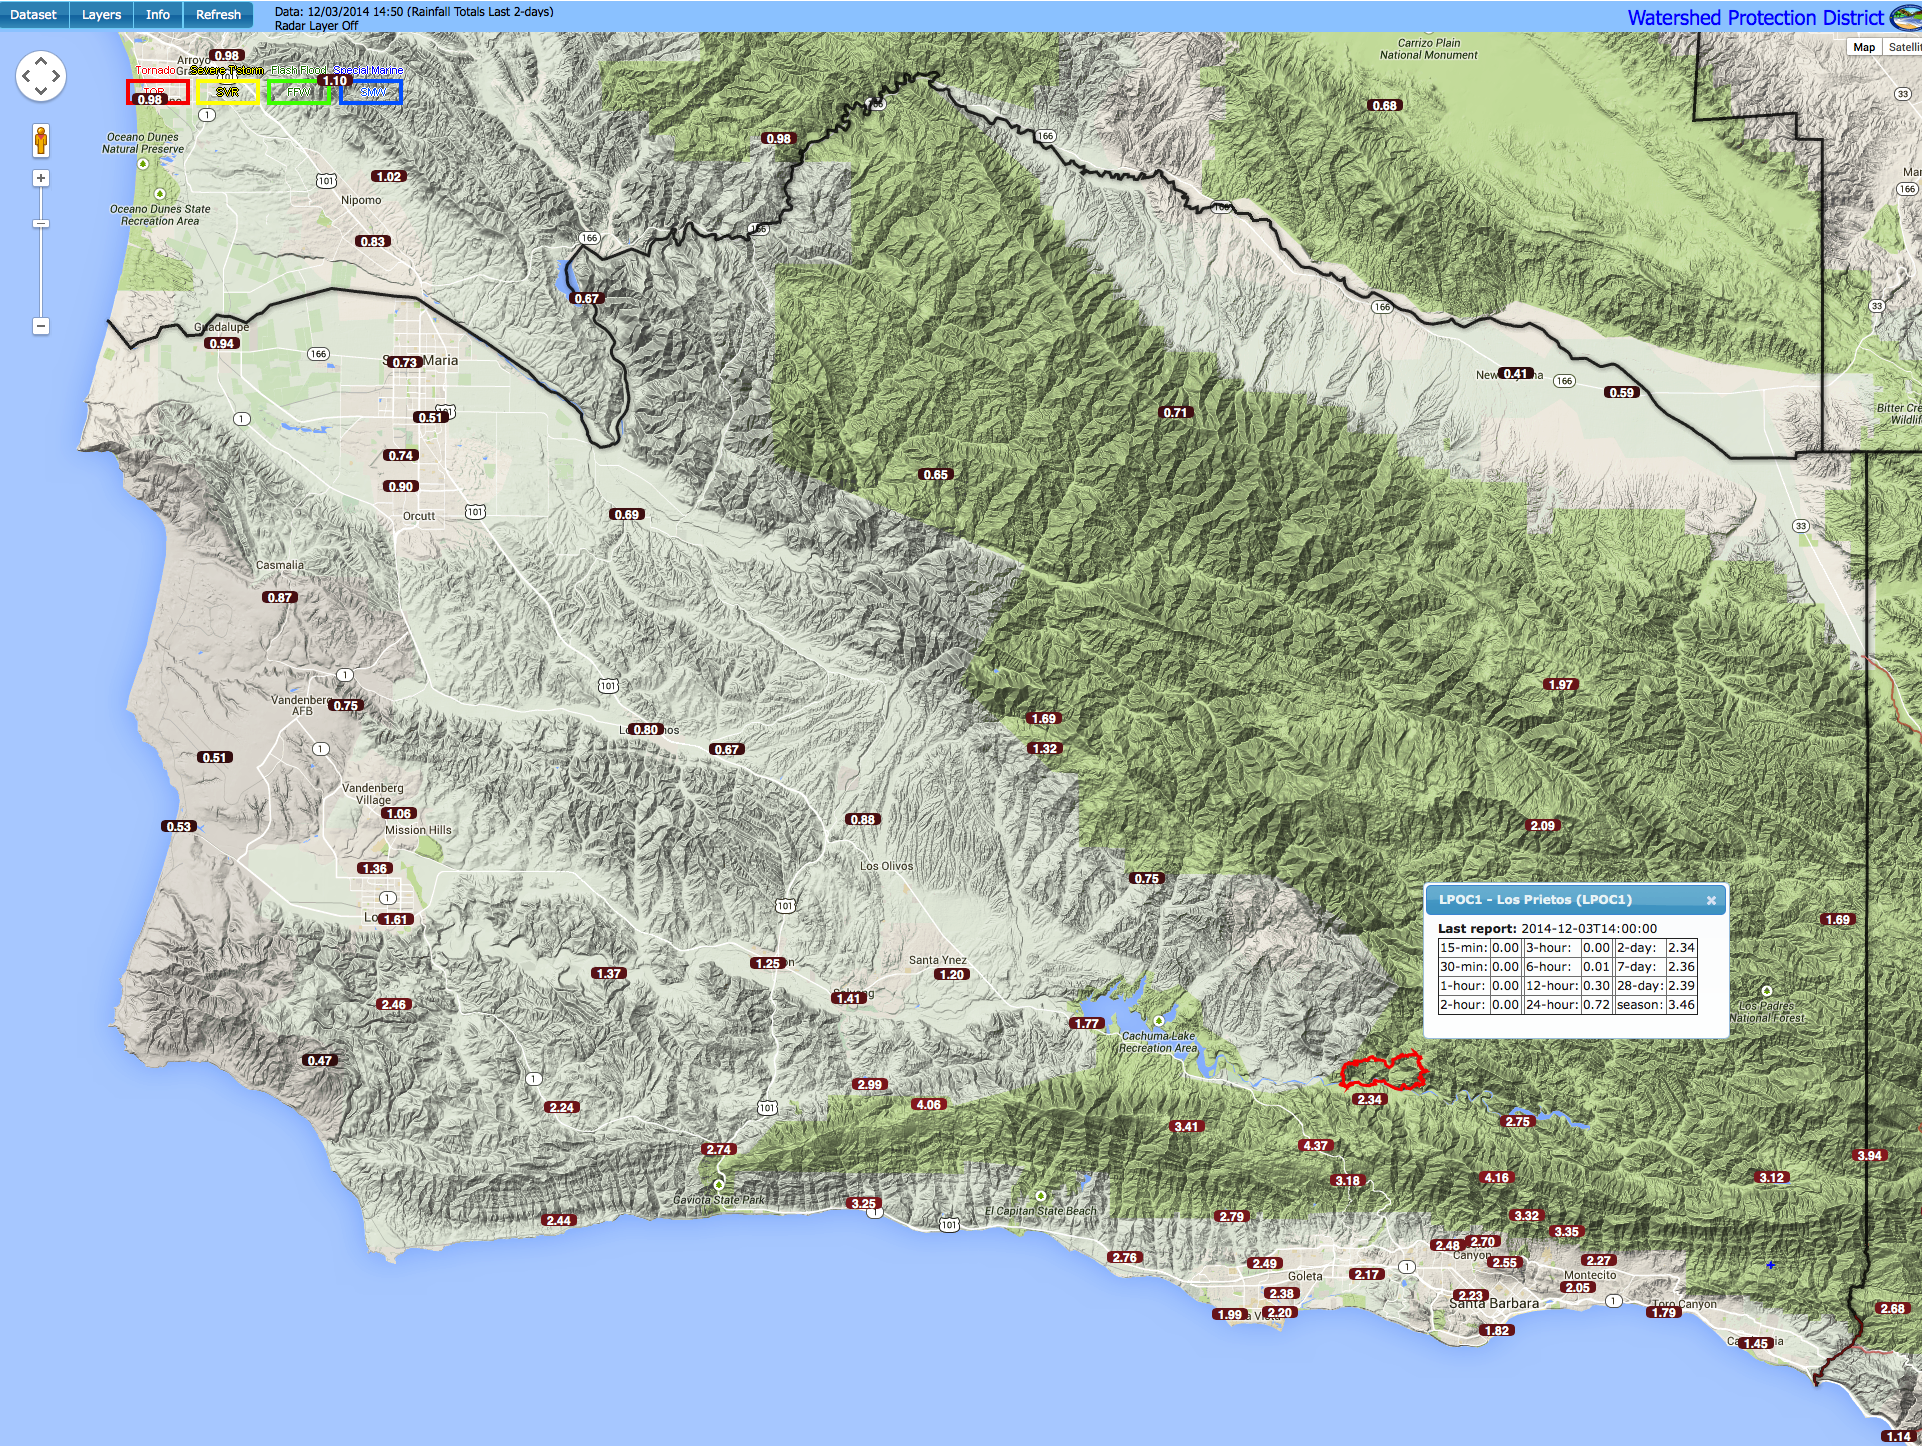
At first glance you’ll see rainfall amounts for the past 24 hours (.28 for the downtown area as an example) but the “Dataset” layer in the upper left corner allows you to check from a vartiety of time periods ranging from the past 15 minutes up to the past 28 days — or even the total for the season. Click on any of the stations and a popup box will provide you with the details for that area.
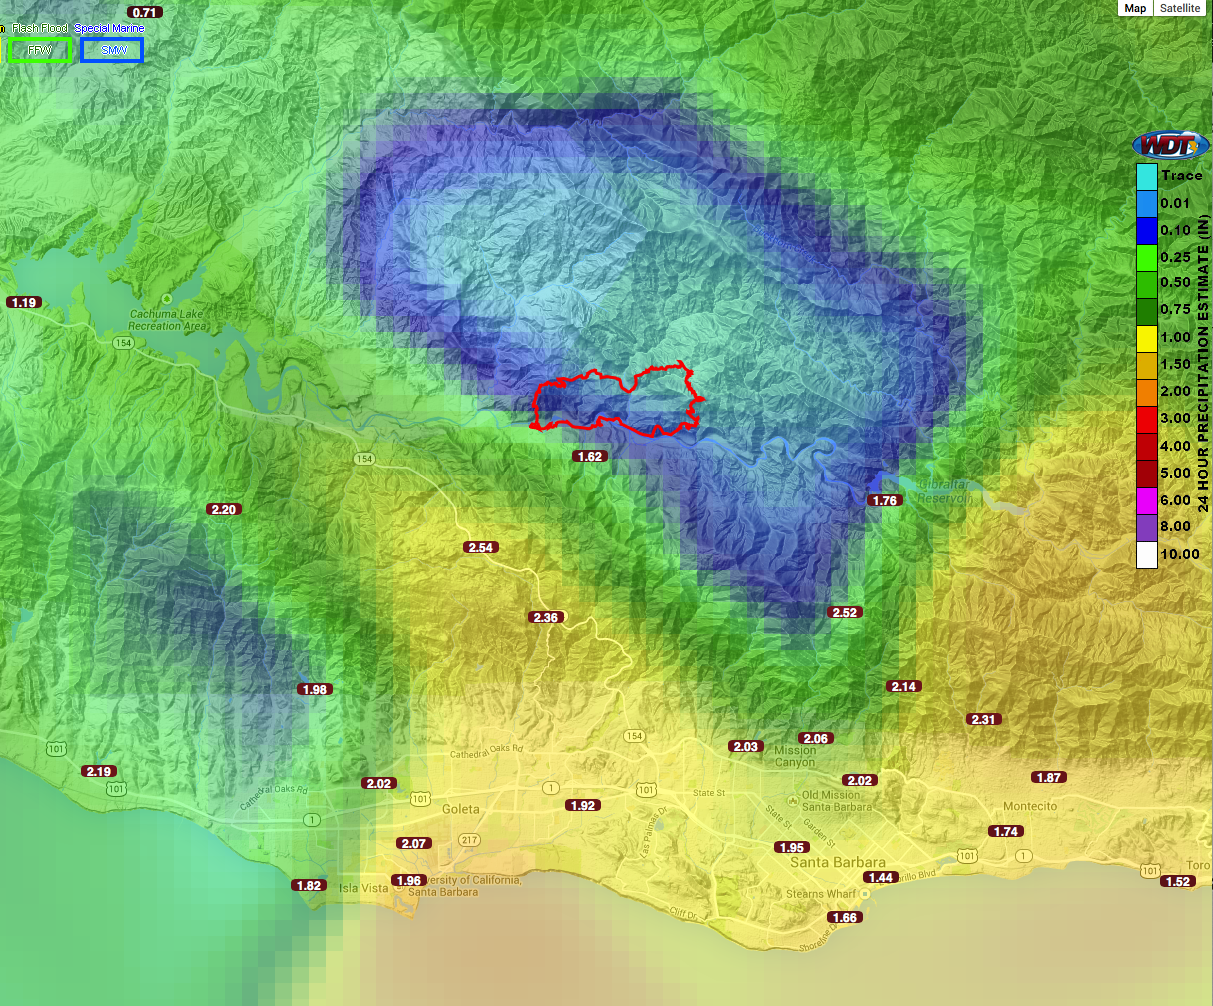
To visualize where it is raining and how intensely, the VCWatershed map also provides a set of layers that overlays radar, satellite and precipitation on the map. The 24-Hour Precipitation layer is particularly nice as it colorizes the map by rainfall amounts making it really easy to see where the rain is falling.
Santa Barbara One Rain
Santa Barbara County Public Works has its own rainfall map and it complements the VCWatershed map perfectly. Dubbed “OneRain”, while the map doesn’t have as many features, the data is real time and receives updates every 6-7 minutes. Click on any of the station icons (the green dots) and you’ll see the rainfall totals broken down into 6-7 minute intervals. While .08” of rain during one of these intervals may not seem like much that turns out to be about an inch an hour, which is flash flood type rain. View SB County OneRain Map
Along with the detailed info there are rainfall tables, creek flow data, historical rainfall data, including wettest and driest years. You’d be surprised to know the 2013-14 year, at 8.06”, is only the 4th driest in Santa Barbara’s history. In 2006-07 Santa Barbara received a paltry 6.41” of rain, way less than we’re experiencing now.
The wettest? A grand total of 46.97” in came down in 1997-98. But probably the most amazing fact regarding historical rainfall is the record for a 24 hour period. In 1969, Jameson Reservoir received 16.31” of rain on one day in late January. The result, massive flows that reach the 30-foot-high mark in the canyon near Red Rock and some of the most devastating losses in the County’s history.
When the next big storm hits, check either the VC Watershed or OneRain sites and you’ll not only be able to keep abreast of where it’s raining but how things are changing. Even when it’s not raining there is an incredible amount of data at both of the sites that you may find of value.