As the climate crisis fuels bigger, badder, and more frequent natural disasters, Santa Barbara County officials have buckled down to create a new Community Hazard Awareness Map. The public resource was built on information from the 2022 Multi-Jurisdictional Hazard Mitigation Plan and crunched reams of data into a user-friendly platform.
The interactive map allows residents to explore their neighborhoods’ risk of fire, flood, landslide, debris flow, and tsunami, as well as sea level rise, earthquake, and “liquification,” when an earthquake loosens and destabilizes soil to such a degree that it behaves like liquid. It draws information from other authoritative sources too, including the California Department of Conservation, the California Geological Survey, and FEMA.
“This map empowers our community with actionable knowledge,” said Kelly Hubbard, director of the Office of Emergency Management. It offers Santa Barbara County residents a clearer picture of what climate-related challenges mean close to home, she explained, and “anyone can now visually expand their familiarity with local hazards and make informed decisions that protect lives, homes, and our shared future.”
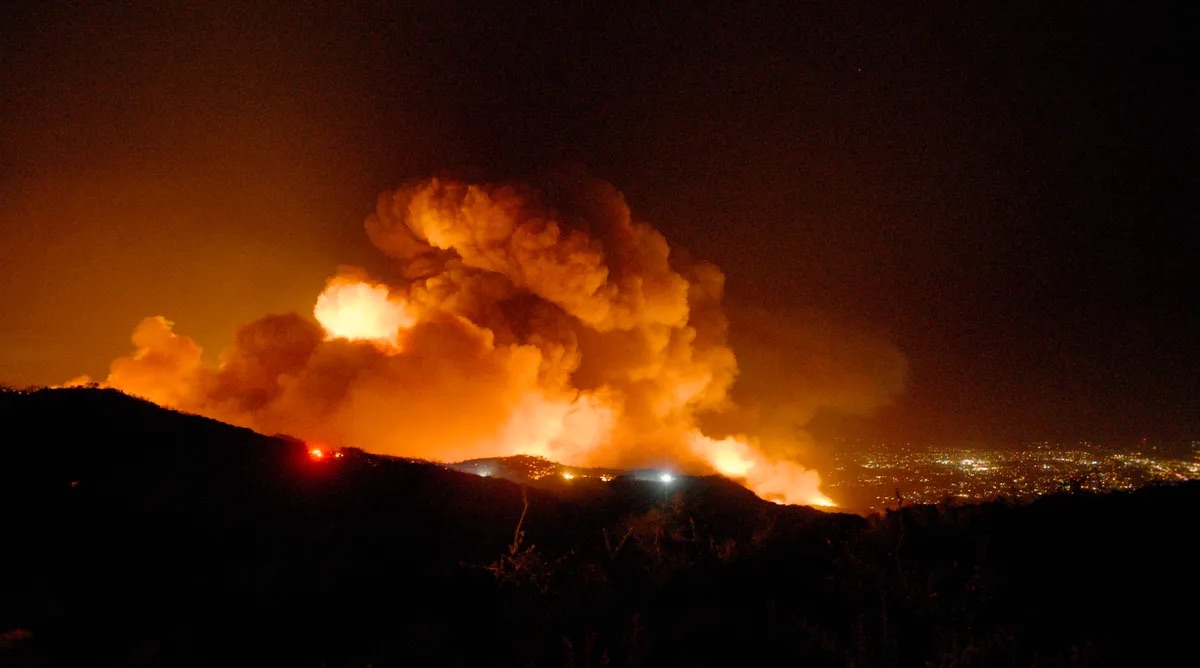
Fire: One of the largest risks to life and property in the 805 is wildfire. According to the map, more than half of the county ― including the foothills and mountains above the South Coast, Gaviota State Park, and areas around Lompoc, Vandenberg Village, and Casmalia ― are designated as “very high” fire hazard zones. Santa Ynez, Los Olivos, and pockets of eastern Goleta Valley are considered more “moderate” zones.
Flood: The map displays low-lying risk areas for a 100-year flood caused by a major rain event (which means a one percent chance of occurring in any given year, as defined by FEMA) and a 500-year flood (a 0.2 percent chance of occurring). Along the South Coast, a 100-year flood would inundate the airport, the lower east and west sides of Santa Barbara, neighborhoods along Montecito creeks, and the center of Carpinteria. A 500-year flood would swamp the eastern half of Lompoc.
Landslide: Given the county’s mountainous terrain, large swaths are susceptible to landslides during heavy rain or earthquakes, the map shows. Most populated areas on even ground are at low risk, but others in and among the hills ― such as Santa Barbara’s Riviera, Alta Mesa, and Mission Canyon neighborhoods, as well as portions of Summerland and Orcutt ― are at higher risk.
Debris Flow: The map highlights two distinct regions at “high” and “extreme” risk of debris flows. Much of Montecito and Carpinteria are still considered hazard zones after the 2016 Thomas Fire and subsequent 1/9 Debris Flow, particularly along waterways such as East Cold Spring, Oak, San Ysidro, Buena Vista, Romero, Toro Canyon, Santa Monica, and Gobernador creeks. Along the Gaviota Coast, where the Sherpa Fire burned in 2017, areas on either side of Gato, Dos Pueblos, and Tecolote creeks are singled out.
Tsunami: Local and distant earthquakes, far-away volcanic eruptions, and underwater landslides can trigger tsunamis along the Santa Barbara County coastline. Data from the California Department of Conservation put Santa Barbara’s waterfront up to Highway 101 ― and a few blocks of the lower east side ― in the danger zone, as well as the Goleta Slough, Devereux Slough, and southwestern portions of Carpinteria.
Sea-Level Rise: The map depicts geographic areas that could face flooding related to sea-level rise by the years 2030 and 2060, during a 100-year flood event. A major flood in 2060 coupled with sea-level rise would bring ocean water all the way up to Santa Barbara’s East De la Guerra Street. The Cabrillo Ballpark and Dwight Murphy Field would also drown, as would the entire airport and its surrounding facilities.
Earthquake: Two earthquake scenarios are laid out: one occurring along the Red Mountain Fault and the other along San Luis Range Fault. The Red Mountain scenario, with the epicenter located in Isla Vista, would spell trouble for the entire South Coast, with damage risks dissipating inland. The San Luis scenario centered north of Santa Maria follows a southeast trajectory of potential damage and peters out near Zaca Lake.
Liquefaction: Areas along waterways are at the greatest risk of liquefaction. Divided between “low,” “moderate,” and “high,” severity, the map puts Santa Maria, Lompoc, Buellton, Ballard, Los Olivos, parts of Santa Barbara and Goleta, and the entirety of the airport and Carpinteria in the moderate- to high-risk zones.
County officials stressed that while the Community Hazards Awareness Map is a valuable tool for personal planning purposes, it does not reflect immediate safety concerns or real-time changes in conditions. During an active emergency, residents should check the county’s Emergency Zones Map for information on evacuations, shelter-in-place orders, and other public safety directives, they said.