By the Numbers: Santa Barbara’s Third and Worst COVID-19 Wave
Doctors Have Expressed Extreme Frustration with Residents Who Continue to Flout Orders
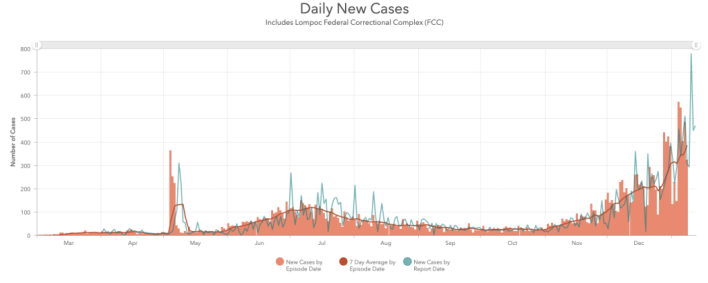
This week, Santa Barbara’s COVID-19 cases shot off the charts — literally. “Our numbers increased by so much that we had to adjust the axes and the scales of the charts and maps,” said Dr. Van Do-Reynoso, the county’s public health director at a press conference.
Active cases in this third and worst wave of the virus are by far the highest they’ve been since the start of the pandemic, exploding to 2,895 on Tuesday, compared to just 241 during the peak of the first wave last spring and 444 in the summer surge.
Get the top stories in your inbox by signing up for our daily newsletter, Indy Today.
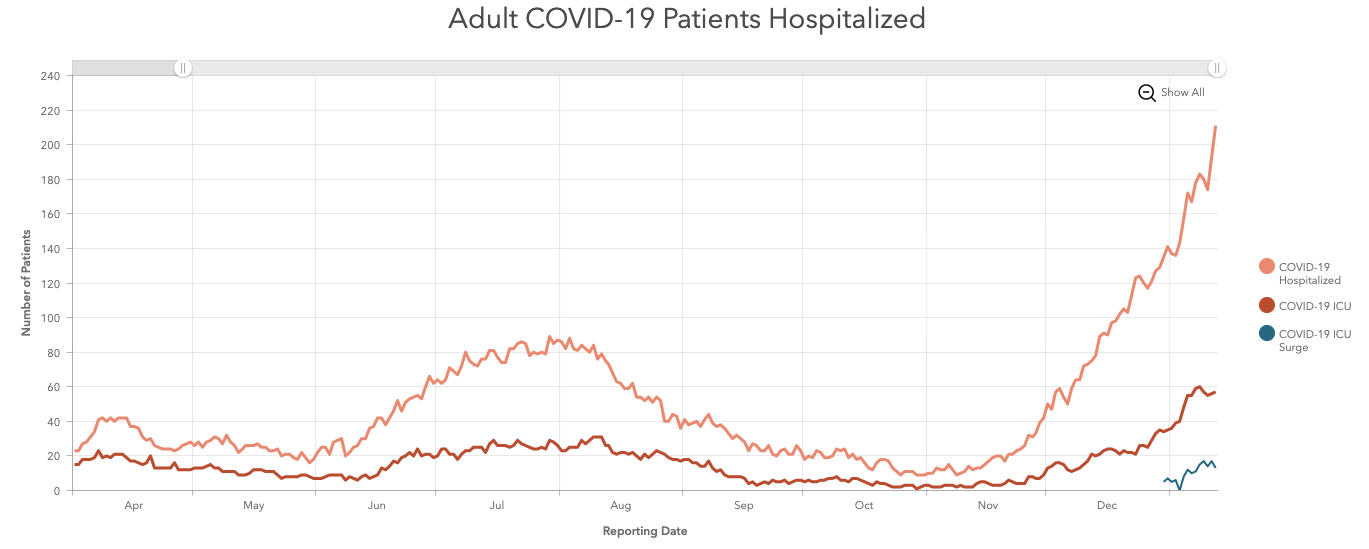
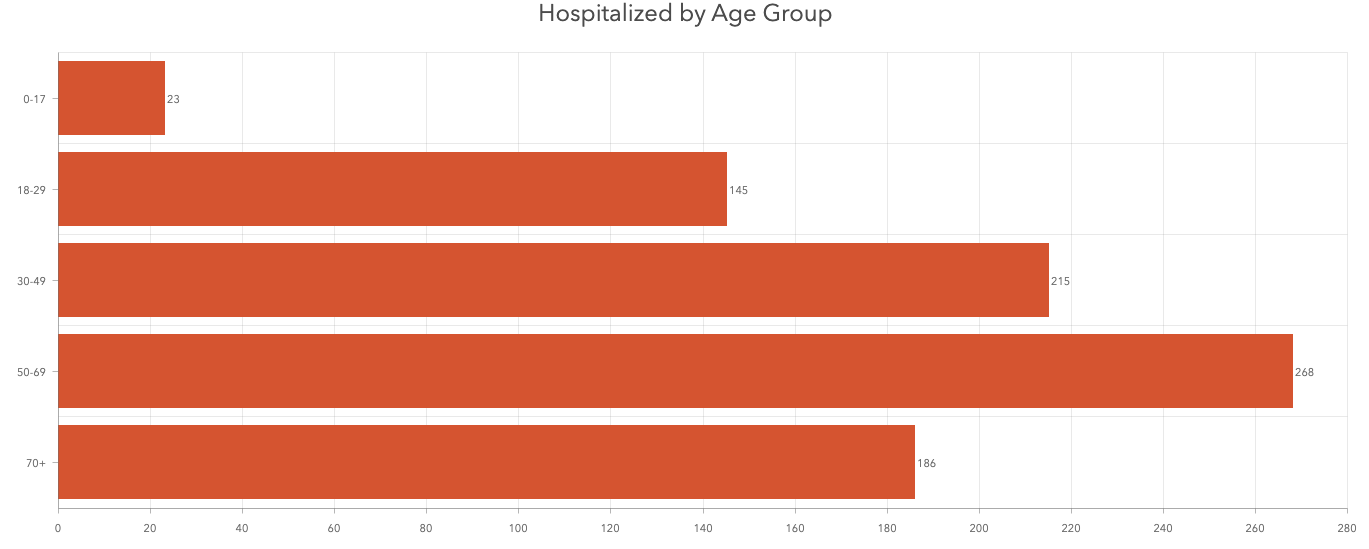
The death count surpassed 200, reaching 207 on Tuesday. That’s a more than 50 percent increase since November 1. Hospitalizations and ICU admissions are at new record levels as well, with 211 and 57 patients, respectively, now receiving emergency care.
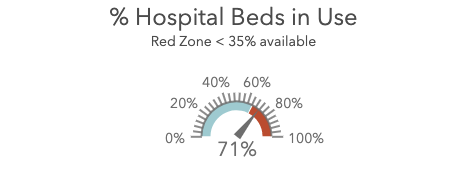
Of the county’s 598 hospital beds, 427 (or 71 percent) are currently in use by both COVID and non-COVID patients. The Health Department’s high-alert Red Zone was breached at 65 percent. Of the 89 staffed adult ICU beds, 80 (or 90 percent) are occupied. That Red Zone was broken at 80 percent.
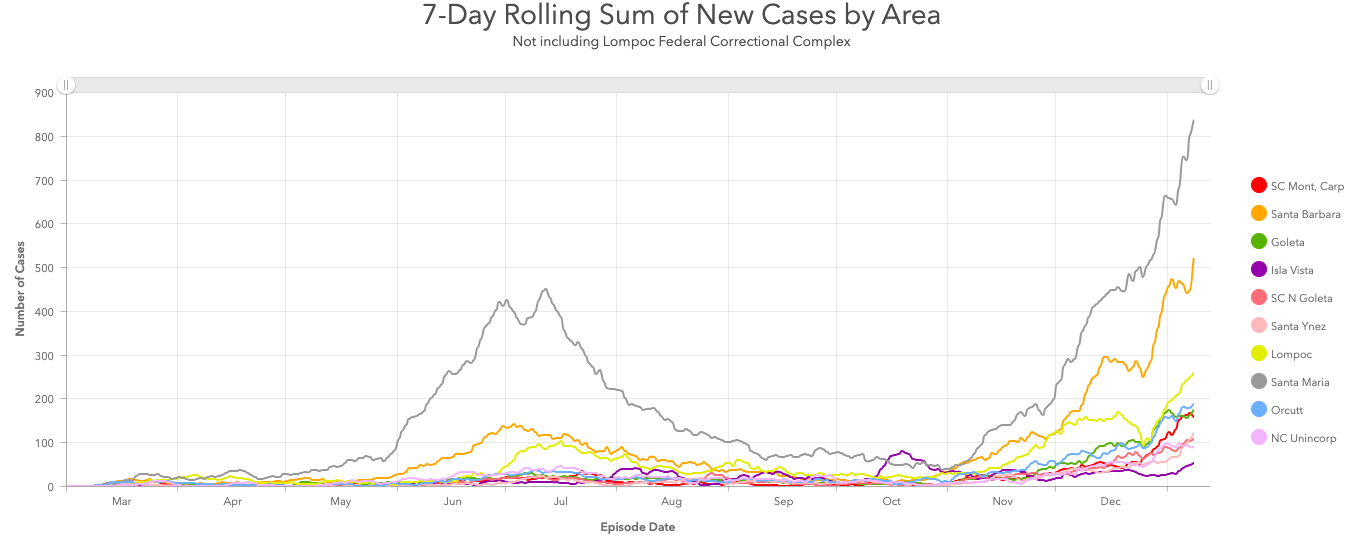
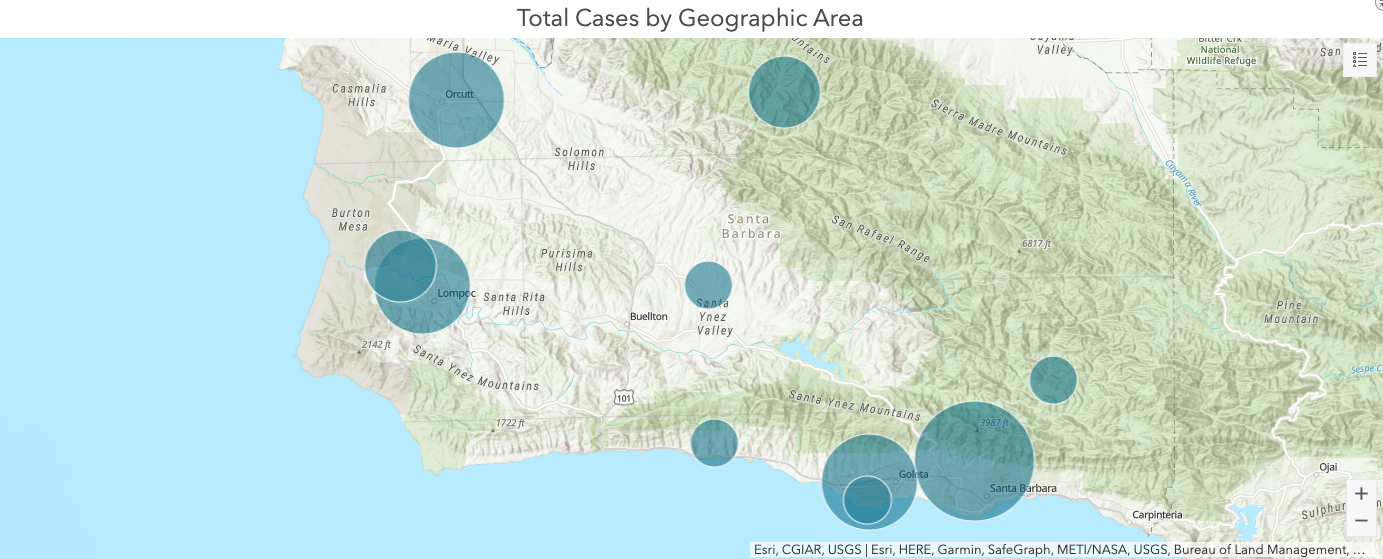
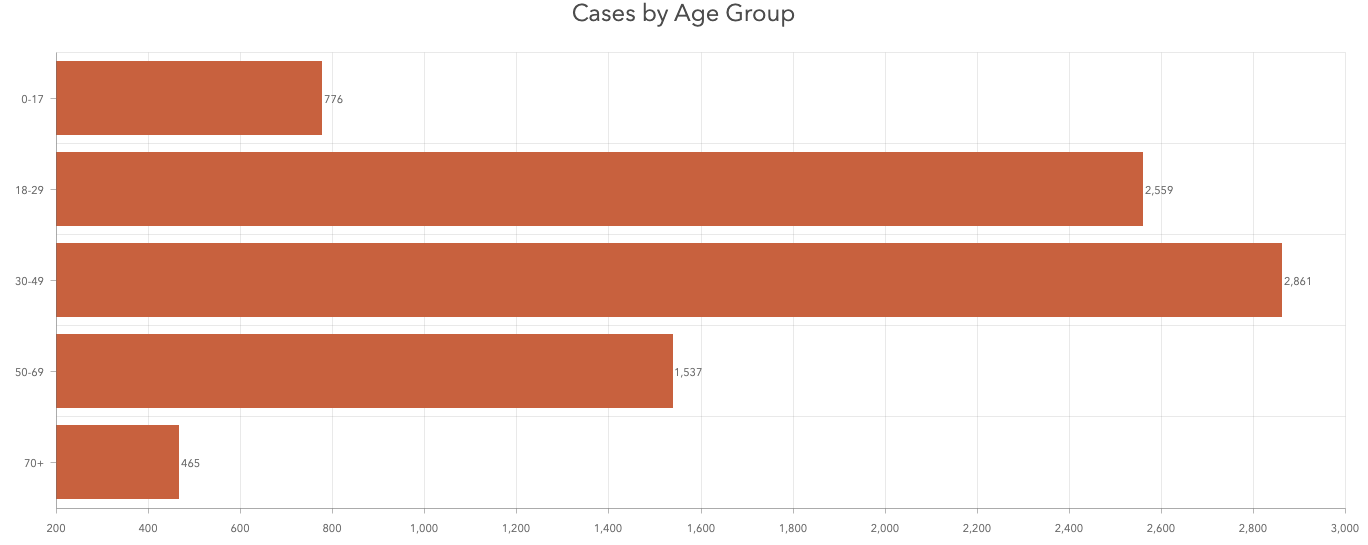
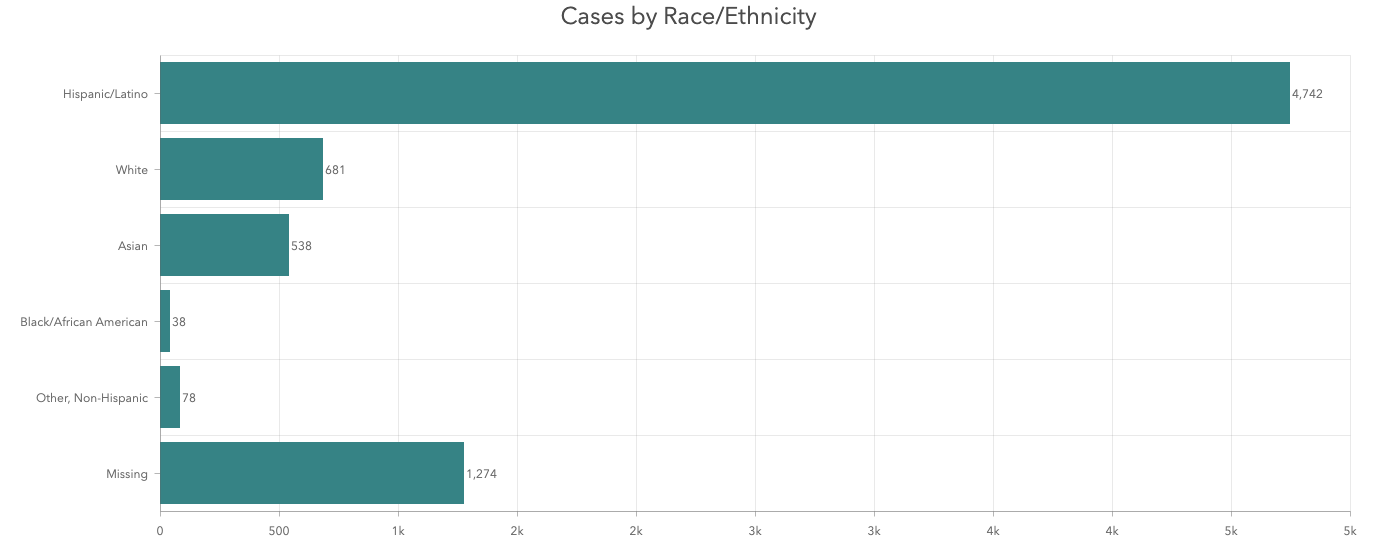
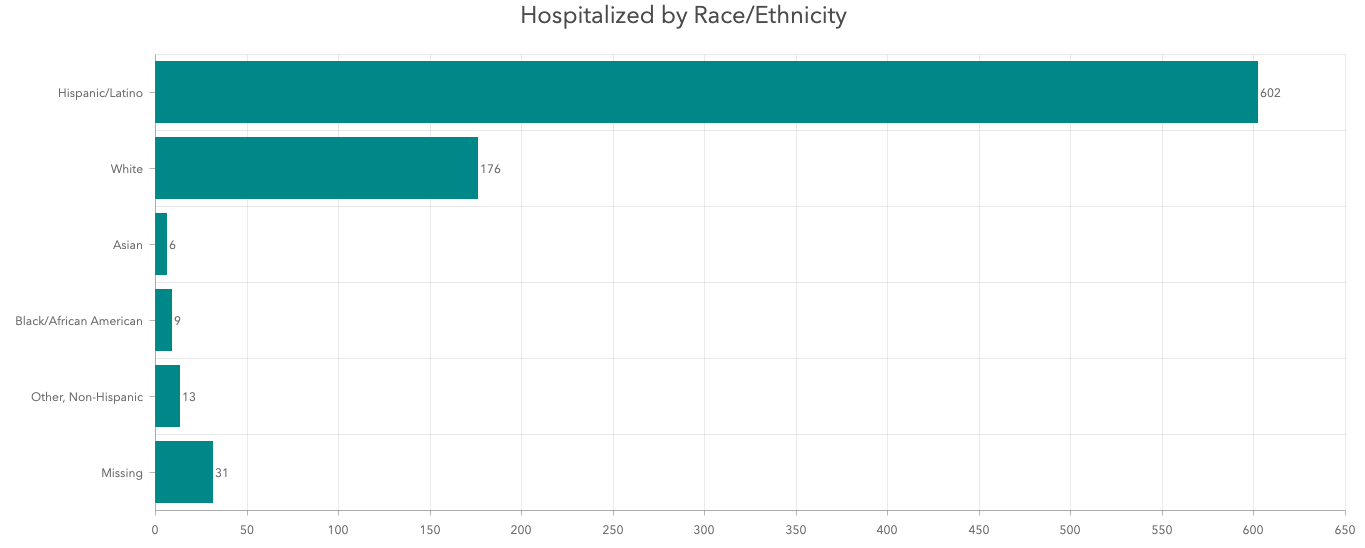
While North County bore the brunt of the virus at the beginning of our regional outbreak, South County is now just as proportionally inundated. The majority of cases have been detected in those between the ages of 18 and 49. Racial disparities in all outcomes are stark.
Ventura and San Luis Obispo counties are reporting similarly high numbers while Los Angeles County grapples with its own uncontrolled outbreaks that are forcing health officials to ration care. Santa Barbara doctors fear it’s just a matter of time before they too are completely overwhelmed. They’ve expressed extreme frustration with residents who continue to flout orders to limit contact and travel, especially those who threw caution to the wind during the holidays.
These rapidly rising figures — and the many other metrics that underscore Santa Barbara’s ballooning COVID-19 crisis — are best understood visually. A sampling of informational graphics found on the Public Health Department’s website are featured here.






You must be logged in to post a comment.