Counting Bicyclists
The Latest Numbers and Why We Need to Do It Right
Nationally and locally, city officials are recognizing that cycling is good for our communities and businesses. So that we can make informed decisions about the best ways to prevent cycling injuries and see if what we are doing works, we need to have accurate data on cycling injuries. But there’s a simple question that is difficult to answer: How (and why) should we measure the number of people who bicycle in Santa Barbara?

Measuring the number of cyclists is essential to transportation planners’ case for increasing and allocating funding to improve cycling infrastructure in the city. For the city and county of Santa Barbara, only one scientifically valid measure is currently available: the American Community Survey (ACS).
This survey is part of the U.S. Census but is conducted every year. Responding is mandatory, and the survey is carefully designed to reflect the makeup of the community. The only question on cycling is “means of transportation to work” and asks people 16 years of age and older who work full or part time: “How did you usually get to work last week? If the respondent usually used more than one method of transportation during the trip, the mode used for most of the distance.” “Bicycle” is selected if it is used for the longest distance. For all the details, check out the report, Modes Less Traveled: Bicycling and Walking to Work in the United States.
Let’s look at the most recent American Community Survey data, released in August 2015. Because data is collected throughout the year and then analyzed, there is an eight-month delay, so the most recent information comes from 2014. Because of the relatively small number of people surveyed each year, five-year averages are used, so the most current data is an average of the years 2010-2014. To see if anything is changing, we compare the current five-year period to previous five-year periods.
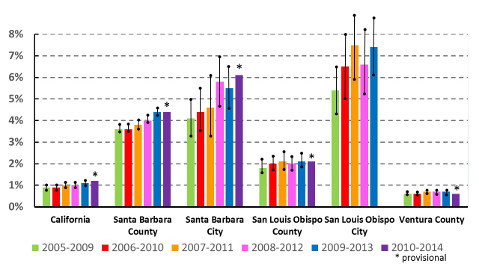
The latest data shows that in 2010-2014, about 6.1 percent of people ages 16 and older in the City of Santa Barbara and 4.4 percent of those in S.B. County bike to work most of the week. These percentages have been increasing steadily, at about 0.3 percent per year in the city about 0.2 percent per year in the county. Among cities with populations over 50,000, Santa Barbara city ranked ninth in the percent of population that biked to work. In California, it was third behind Davis, Berkeley, and Palo Alto.
The data can also be broken down by zip code. For the City of Santa Barbara, more than 75 percent of the estimated 2,500 people who cycle to work or school live in the zip codes 93101 and 93103.
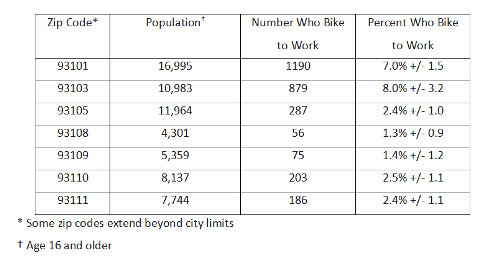
In the county, about 40 percent of the estimated 8,500 people who cycle to work live in the zip code 93117, which includes Isla Vista and western parts of Goleta, and 30 percent live in the City of Santa Barbara
Because of the way it’s worded, the American Community Survey significantly underestimates the total number of bicyclists. Not included are the many Santa Barbara residents who bike to school, part of the way to work and take the bus, for recreation (with family to the park or on the paths along the beach or for the ultimate challenge up Gibraltar or over San Marcos Pass), for errands, to dinner, or to visit friends.
But how can we count the rest of the cyclists? To complement the Community Survey, we need to know where they live and why and how often they bike. From health benefits to the impact on decreasing automobile congestion, it makes a big difference whether one rides every day or just a few times per year. We would also want to make sure to give extra consideration and attention to those who are dependent on bicycles for transportation.
While there are a multitude of different ways get some of this data, the National Bicycle & Pedestrian Documentation Project has done some excellent preparatory work. The group’s basic assumption is that “in order to estimate current and future bicycle and pedestrian demand agencies nationwide need to start conducting counts and surveys in a consistent manner.” A set of guidelines was published to assist jurisdictions in standardizing the counts of cities across the country and make them comparable. Caltrans has urged jurisdictions in California to use these methods rather than ad hoc approaches These guidelines and the UC Berkeley Traffic Center study provide the methodology that Santa Barbara should adopt for future bike counts.
Given the billions America spends on highways, measuring the activity of motorists is an industry unto itself. But data collection on biking is much less rigorous. There isn’t one way to measure all the diversity. However, if we use standardized methods, we will begin to paint a fuller picture of cycling within our community and provide the data for infrastructure improvements that will increase bicycling accessibility and safety. Stay tuned for more information on making cycling count!