
Some revelations are obvious but still startling nonetheless.
Such is the case with Cottage Health’s second Community Health Needs Assessment, conducted in 2019. Based on a survey of 900 respondents, fully 21.5 percent of adults reported being “food insecure.” This survey, it should be noted, was conducted before the COVID-19 pandemic.
The good news is that this number did not increase appreciably since a similar population-health survey was commissioned by Cottage three years previously. The grimmer news is that 32 percent of Latino respondents reported being food insecure while 15 percent of non-Hispanic whites did. For respondents who reported making less than $35,000 a year — and those who never finished high school — the numbers were 40.9 percent and 40.7 percent, respectively.
The same disparity jumps out when looking at numbers for housing insecurity. Overall, 13.3 percent of the respondents reported feeling “housing insecure.” That’s up from 10.7 percent three years prior, a jump deemed statistically “non-significant.” But as was often the case with Cottage’s health survey results, they told a tale of two disparate realities. Twenty percent of all Hispanic respondents reported feeling housing insecure, whereas 9.5 percent of white respondents did. For those making less than $35,000 a year and those who didn’t graduate high school, the numbers are 29 and 32 percent, respectively.
Get the top stories in your inbox by signing up for our daily newsletter, Indy Today.
“Food insecurity” is defined, at least for the purposes of this survey, as not having the money to buy more food in the past 12 months when what one had ran out. It also applied to instances the respondents ate less than they felt they should because there wasn’t enough money to buy more. “Housing insecurity” describes the psychological state of respondents worried they may not have stable housing in the next two months.
Five years ago, Cottage Health embarked on an expansive population health program, jumping in feet first, its board going so far as to change the hospital’s mission statement accordingly. Cottage could no longer confine itself to worrying about the health care provided within its “four walls,” the thinking went. It had to reach out more to the community at large.
A key component of that new mission was to strip mine all the relevant health-care and census data to provide a telling snapshot of unmet community needs. Likewise, this brain dump would be made available to nonprofits and community groups for their own edification and to help them write grant applications more tailor-made to the problems they sought to address.
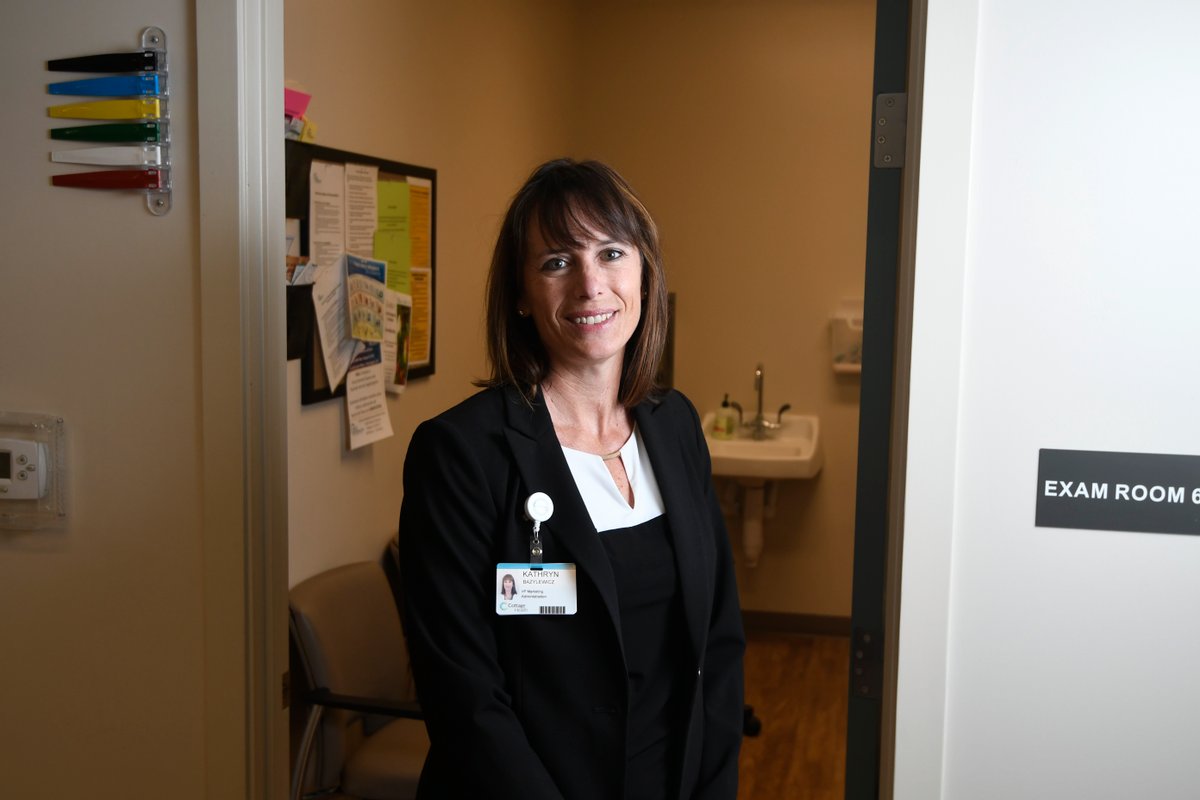
Cottage VP of Marketing and Population Health Kathryn Bazylewicz, working closely with Population Health Manager Monica Ray, just released the second of these population-health brain dumps last week. In addition to the 900 detailed phone surveys, Cottage conducted 30 focus groups, interviewing 251 stakeholders — many health-care and social service providers — in order to put the data in better context. Because members of underserved communities tend to not answer their phones in disproportionately high numbers, extra efforts were made to seek input from organizations working with the Latinx community.
And what was Bazylewicz and Ray’s big takeaway? “The disparities are getting greater.”
They were struck by this, especially when it came to housing insecurity. Their report included many remarks on the subject from stakeholders interviewed as part of Cottage’s Listening Tour.
“A lot of people are having extended family — 12, 13 people — in a one-bedroom apartment on the Eastside or the Westside,” said one nurse.
“You have families where you don’t have your own kitchen; you don’t have your own refrigerator; you have to share all this with other people,” added one subject.
“There’s so many kids who we consider homeless,” said one North County service provider. “We’re one of the highest counties in the state in terms of children considered homeless, or that’s overcrowded, or actually living in a car.” Another service provider noted, “There’s not a lot of us who can afford to live here, which leads to social isolation, which leads to a sense of rage.”
Overall, the report found the greatest discrepancies tracked according to ethnicity, income, age, and educational achievement.
Seventy-seven percent of the respondents reported enjoying overall good health, a slight drop from three years ago. For whites, it was 84 percent; for Latinos, 68. For those making less than $35,000, it was 63 percent, and for those who never graduated high school, it was only 51 percent.
In almost all categories, the numbers declined somewhat from the previous survey. Not surprisingly, health insurance coverage tracked pretty much the same. Overall, 87.5 percent reported having insurance; for whites, it was 96.3 percent, and for Latinos, it was 75 percent. For those who didn’t graduate high school, it was 64 percent.
There was some good news. Diabetes numbers have dropped across the board, even for those making less than $35,000 a year. Binge-drinking is dropping in most demographic categories, and the increases are less than statistically significant.
As for mental-health indicators, the picture was more mixed, but not encouraging. Overall, for the number of respondents saying they’d been told by a doctor they suffered from some sort of depression, the numbers increased from 18.3 percent to 23.9, which is less than significant.
For women, the increase was from 21.9 to 29.8 percent; for men, it was 14.6 to 17.8 percent. For Latinos, the jump was from 13.2 percent to 17.8; for whites, it was 23 to 28.3 percent. The state benchmark for depression was 15.4 percent. The national benchmark was 20.6.
For people between the ages of 18 and 44, the increase for depression was more pronounced — from 15.4 percent to 26.2. For people making less than $35,000, the increase was even greater — from 18.1 percent three years ago to 29.8 percent in 2019.
Again, these numbers reflect the views of the respondents in 2019. They do not reflect how those views may have changed with the advent of COVID.
For those interested in exploring these numbers for themselves — or checking out how census maps correlate to health-care concerns — visit cottagehealth.org/pophealth.
Every day, the staff of the Santa Barbara Independent works hard to sort out truth from rumor and keep you informed of what’s happening across the entire Santa Barbara community. Now there’s a way to directly enable these efforts. Support the Independent by making a direct contribution or with a subscription to Indy+.


