
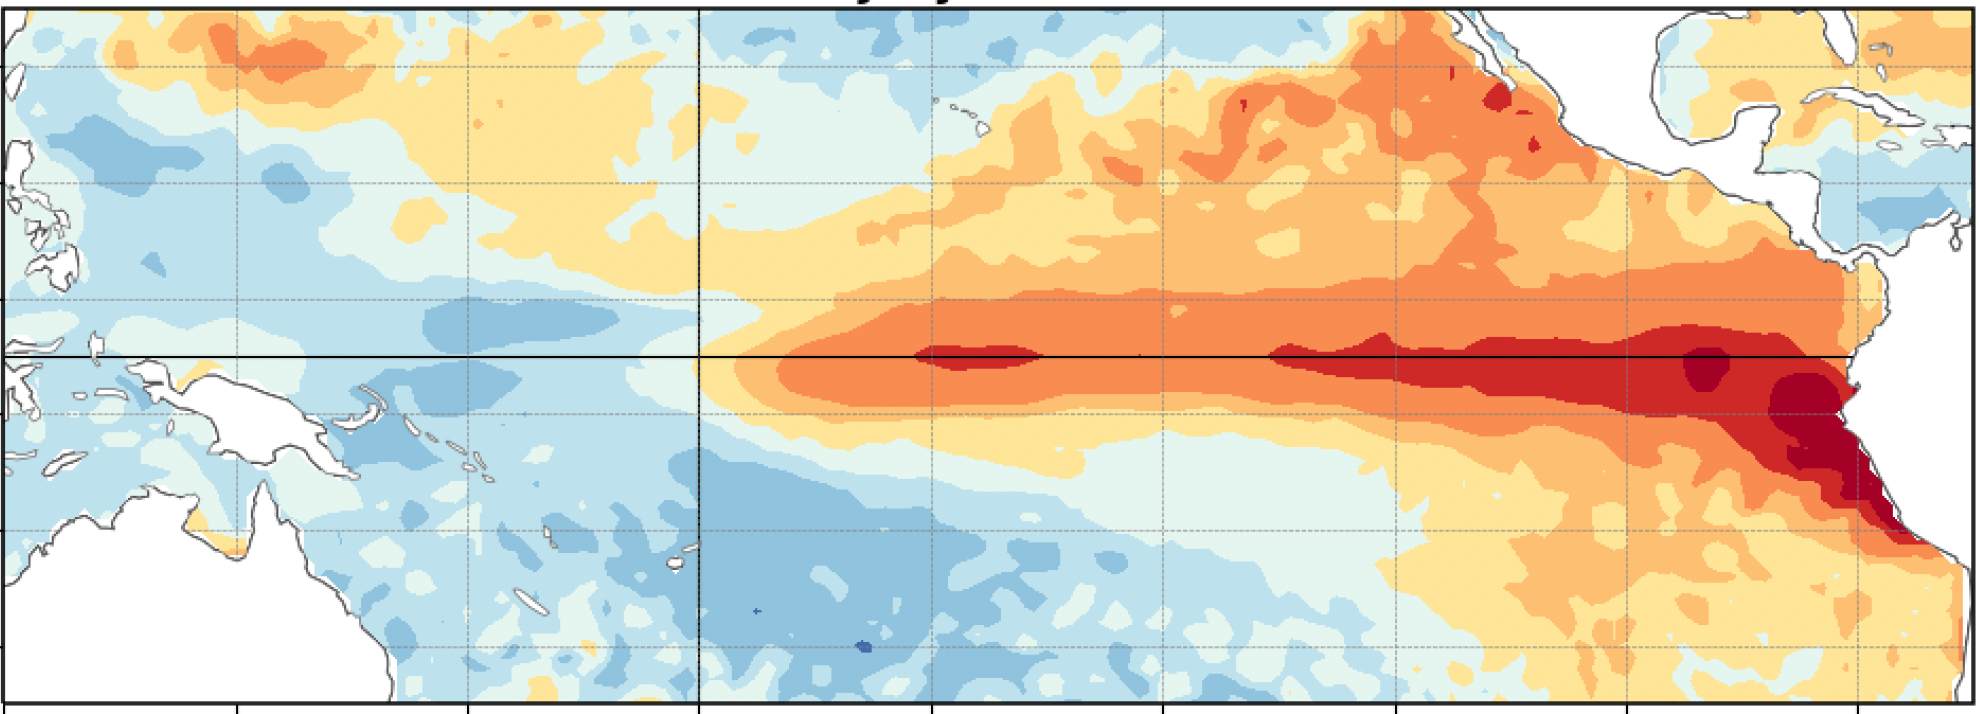
The monthly El Niño discussion released by the Climate Prediction Center held a startling number this August: The temperatures below the ocean surface reached a striking 10°C (18°F) higher than normal, and that’s at about 100 meters (330 feet) below the surface. “It’s an indication that there is a lot of fuel still left in the tank to fuel this El Niño,” said Michelle L’Heureux, who heads up the El Niño team at NOAA’s Climate Prediction Center.
In fact, across the entire eastern Pacific — the equatorial waters that generate an El Niño — the increases in temperature from the surface down to 330 meters (1,082 feet) are the largest in a historical record that goes back to 1980, she said. However, the large temperature changes in the deeps will remain down at the thermocline, where rapid mixing of the upper-ocean warm layer and cooler bottom water can lead to big anomalies.
At the surface, the temperature increases range from 1.4°C near Tahiti to 2.9°C at coastal South America (or 2.5-5.2°F). These are up a couple tenths of a degree (Celsius) from the month before, adding to the certainty that an El Niño is headed our way. That forecast grew over the summer, reaching 81 percent in July and 90 percent in August.
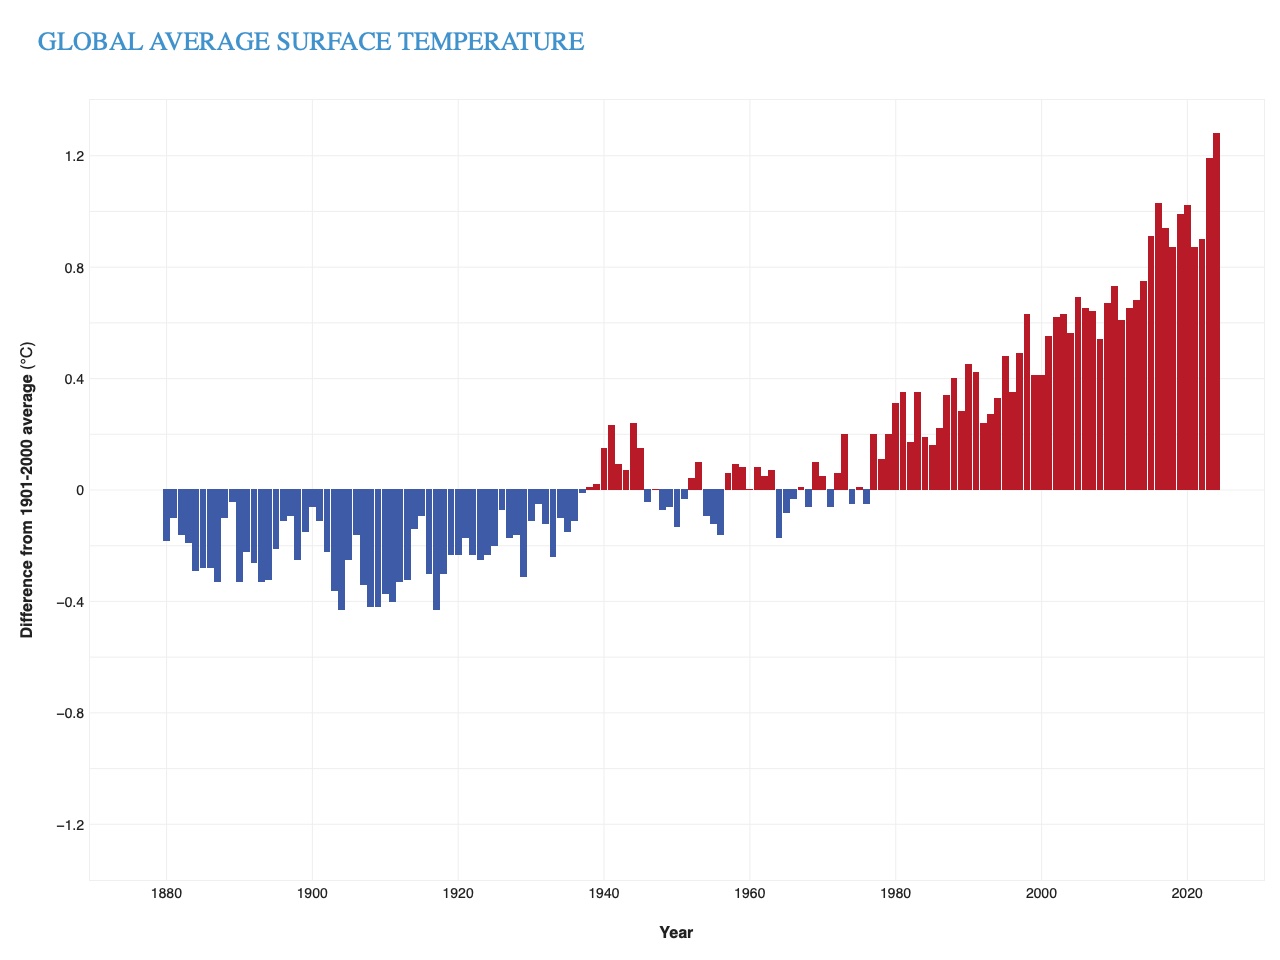
As the warmer waters heat the atmosphere above, in the Pacific region, the jet stream drops southward and pulls storms in from the ocean. Globally, 2025 was the third warmest year on record since 1850, according to Berkeley Earth, despite it being a La Niña year, or the opposite of an El Niño and cooler. A mix of reasons account for the temperature variations, both natural and manmade, Robert Rohde wrote at Berkeley, with methane, carbone dioxide, and other greenhouse gase levels steadily growing over the past five decades.
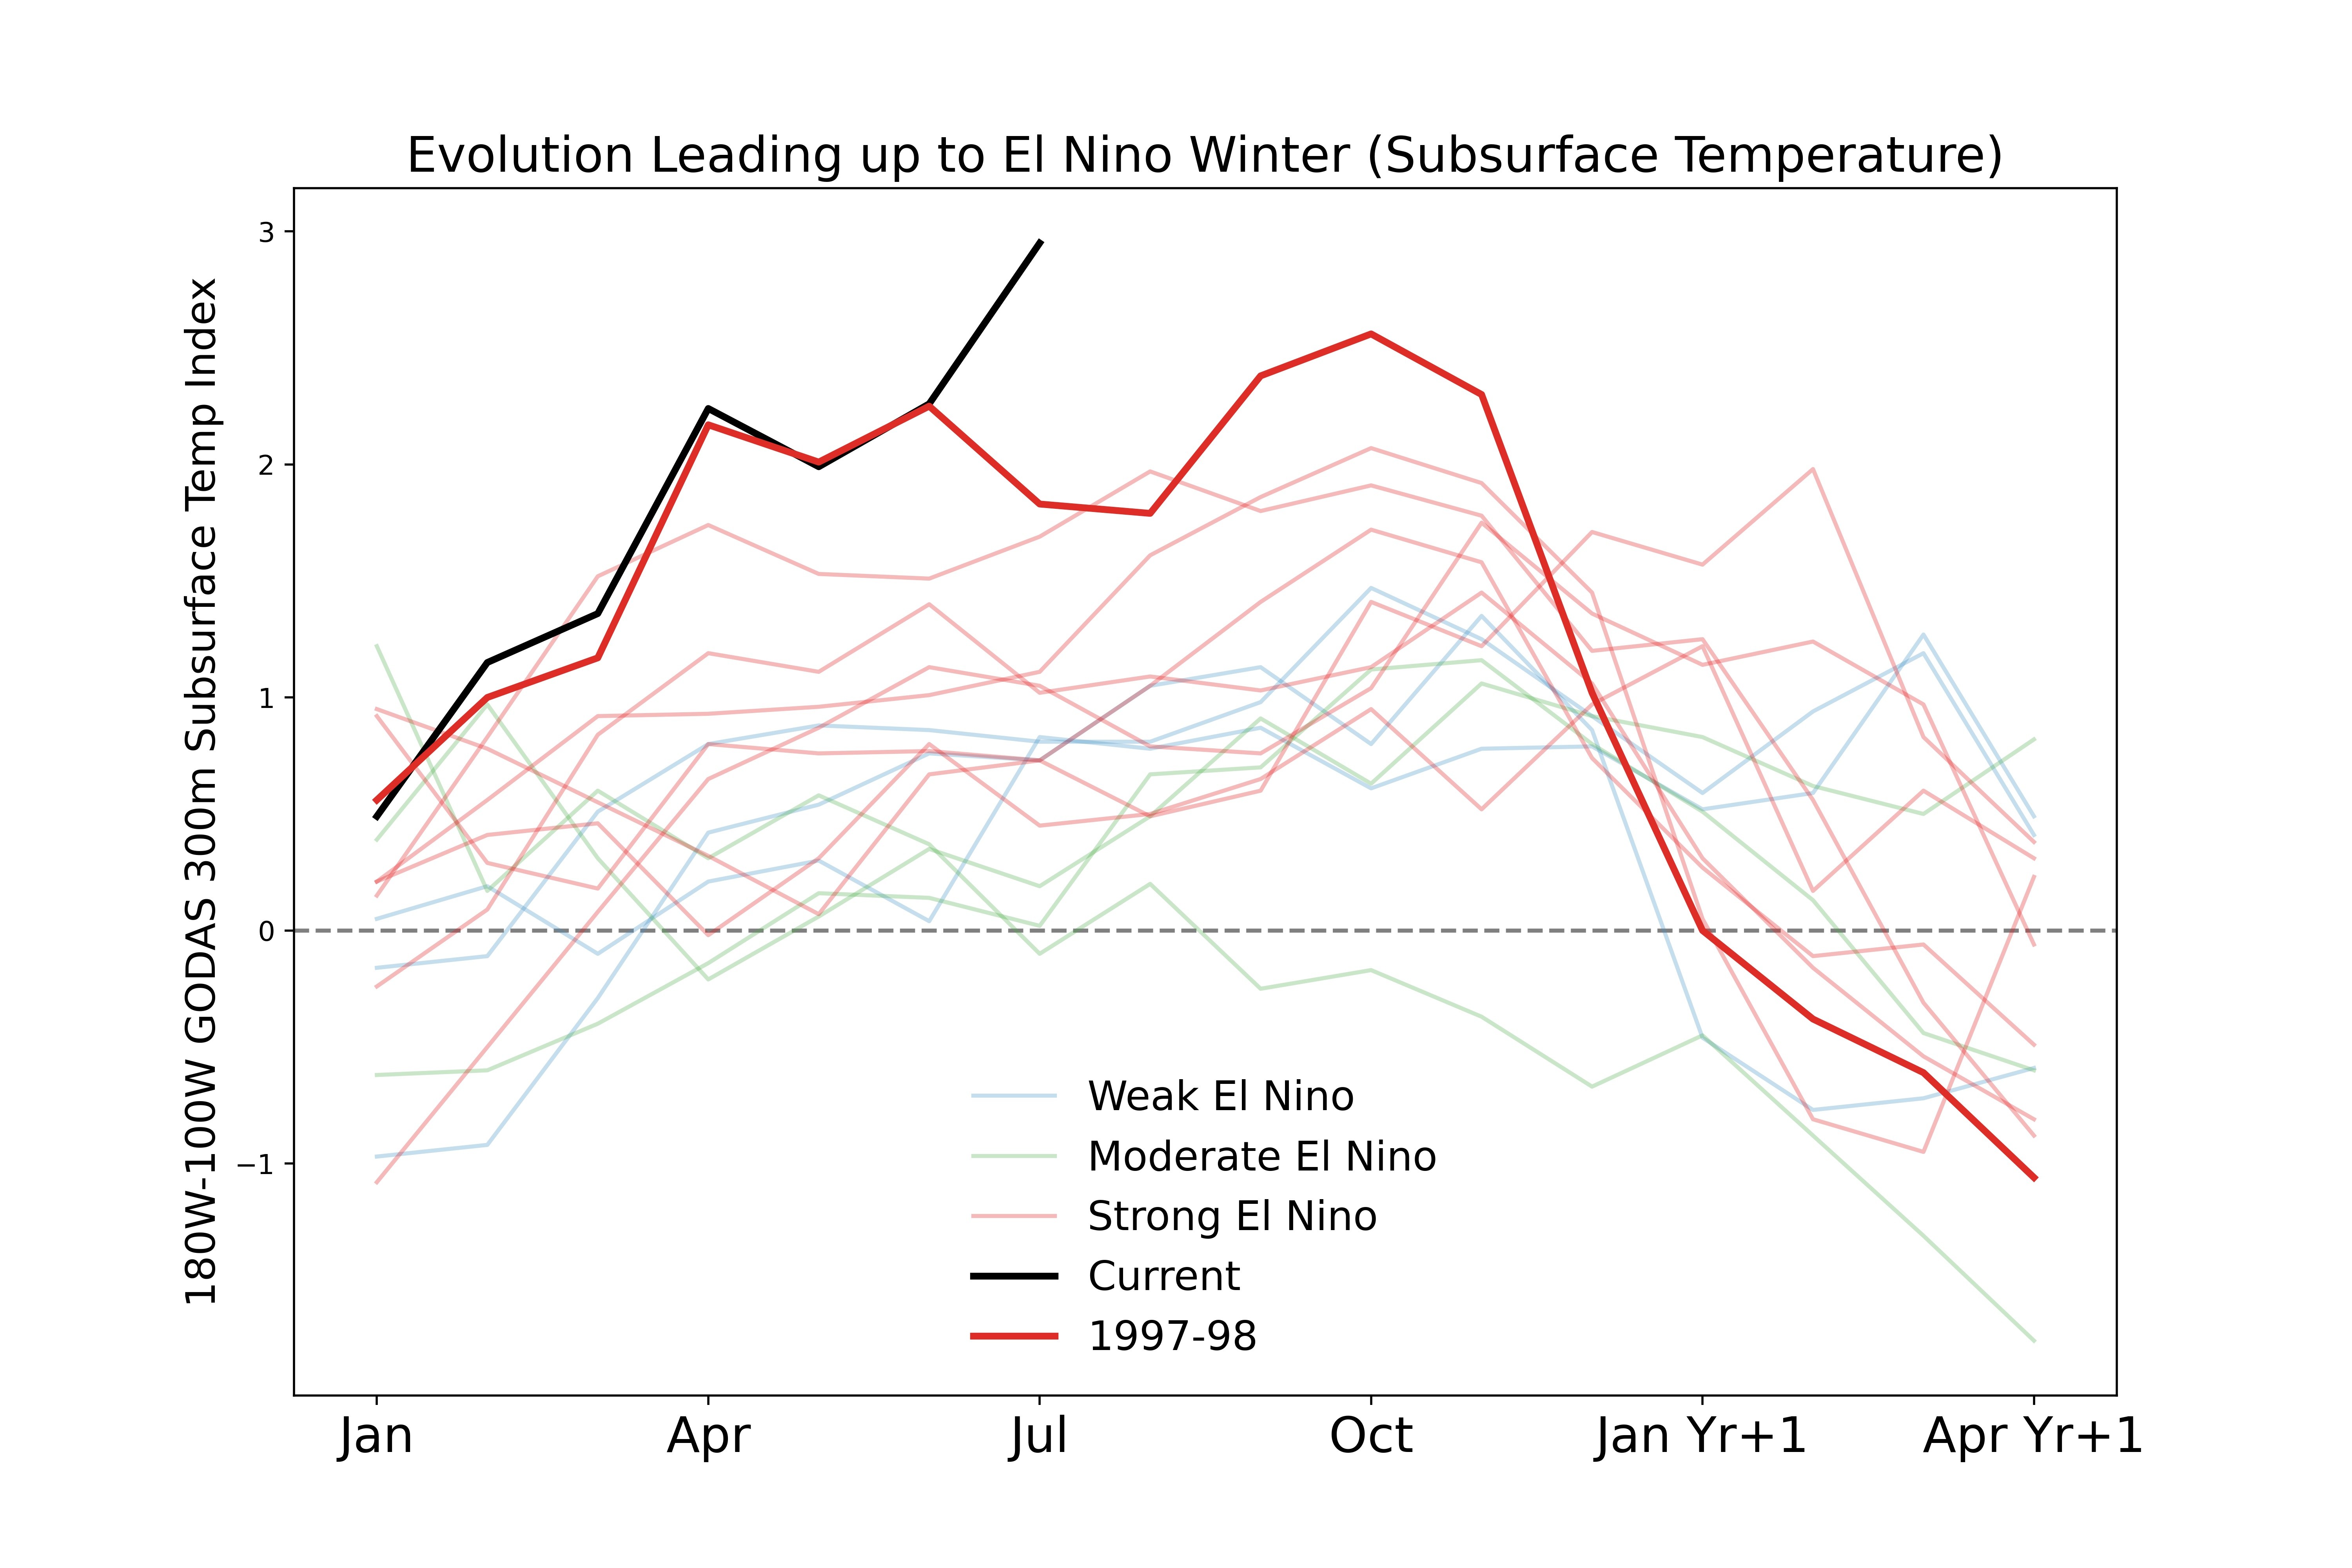
For Santa Barbara, the collection of mid-Pacific readings are retracing the tracks of El Niño in 1997-98, which was a heavy one that saw rain reaching 247 percent of normal and 87 inches at San Marcos Pass and 46 inches downtown.
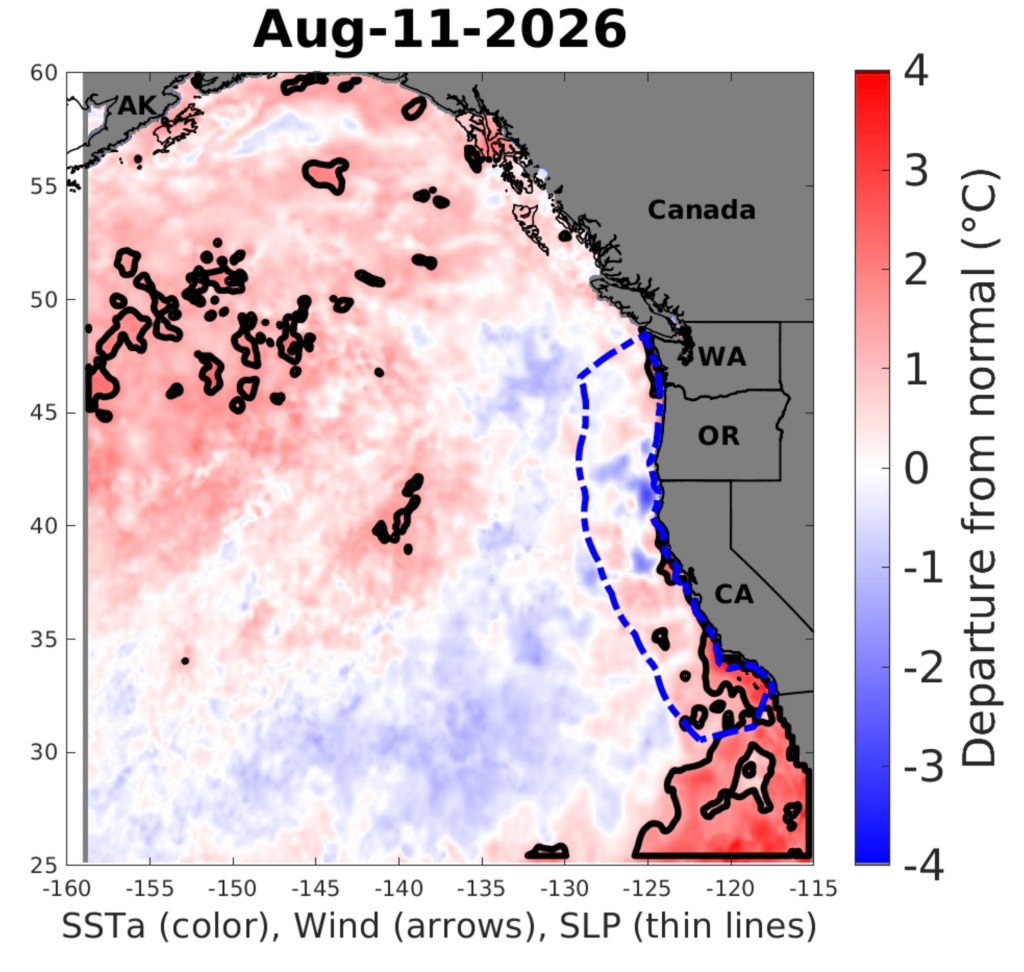
Separately, the Blob off Southern California has moved into the Santa Barbara Channel. The ocean, which is seasonally warmer as fall approaches, is now several degrees above that normal.
Related Posts


Premier Events
Sat, Oct 24
2:00 PM
Santa Barbara
Japanese Sacred Architecture: Shinto and Buddhism
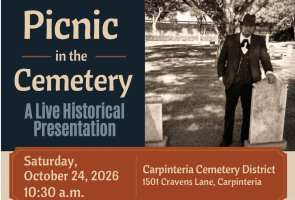
Sat, Oct 24
10:30 AM
Santa Barbara
Picnic in the Cemetery: A Live Historical Event
Sat, Oct 24
11:00 AM
Goleta
2nd Annual Charger Cup to Benefit DP High Golfers

Sat, Oct 24
12:00 PM
Santa Barbara
Makers Hive Market
Sat, Oct 24
2:00 PM
Santa Barbara
Japanese Sacred Architecture: Shinto and Buddhism

Sat, Oct 24
2:00 PM
Santa Barbara
Thriller 2026 – Get Scary for Charity!

Sat, Oct 24
3:00 PM
Santa Barbara
Downtown Santa Barbara Trick-or-Treat
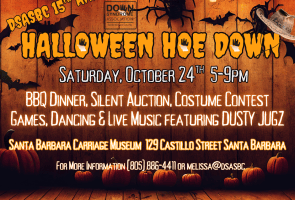
Sat, Oct 24
5:00 PM
Santa Barbara
15th Annual DSASBC Halloween Hoedown

Sat, Oct 24
5:30 PM
Solvang
Solvang Haunted House and Street Fair
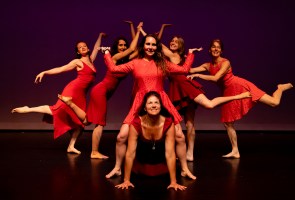
Sat, Oct 24
7:00 PM
Santa Barbara
Anima: Theater of the Feminine Underground
Sun, Oct 25
11:00 AM
Santa Barbara
Free Family Day: Día de los Muertos
Sat, Oct 24 2:00 PM
Santa Barbara
Japanese Sacred Architecture: Shinto and Buddhism
Sat, Oct 24 10:30 AM
Santa Barbara
Picnic in the Cemetery: A Live Historical Event
Sat, Oct 24 11:00 AM
Goleta
2nd Annual Charger Cup to Benefit DP High Golfers
Sat, Oct 24 12:00 PM
Santa Barbara
Makers Hive Market
Sat, Oct 24 2:00 PM
Santa Barbara
Japanese Sacred Architecture: Shinto and Buddhism
Sat, Oct 24 2:00 PM
Santa Barbara
Thriller 2026 – Get Scary for Charity!
Sat, Oct 24 3:00 PM
Santa Barbara
Downtown Santa Barbara Trick-or-Treat
Sat, Oct 24 5:00 PM
Santa Barbara
15th Annual DSASBC Halloween Hoedown
Sat, Oct 24 5:30 PM
Solvang
Solvang Haunted House and Street Fair
Sat, Oct 24 7:00 PM
Santa Barbara
Anima: Theater of the Feminine Underground
Sun, Oct 25 11:00 AM
Santa Barbara


You must be logged in to post a comment.