
Students in the Santa Barbara Unified School District are making strides, according to statewide test score data released last week.
However, there is still a substantial achievement gap between white and Hispanic/Latino students, the two groups that together make up 90 percent of the district’s student population.
The data comes from the California School Dashboard, which helps families understand how schools are performing year to year.
According to the district, the Dashboard measures English language arts and math performance using “distance from standard.” It shows how far students’ test scores are, on average, above or below the score needed to meet grade-level expectations.
Points are translated from student performance on state assessments taken annually by students in grades 3-8 and grade 11.
Districtwide increases show stronger overall performance among students compared to the prior year. But that does not mean every student improved or is meeting grade-level expectations.
English and math proficiency improved 6.5 points and 5.8 points, respectively. In 2025-26, SBUSD moved above the English proficiency standard by 4 points.
Overall, the district is ahead of the state in English proficiency by 11.5 points. But the state itself sits 7.5 points below proficiency standards.
In math, the district is still 21.5 points below the proficiency standard (but 17.4 points ahead of the statewide result).
“The gain brought the district closer to grade-level expectations, although more work remains to reach them,” the district said.
For the California Assessment of Student Performance and Progress (CAASPP) test, specifically, the district’s results showed an increase of two points in English and three points in math. Overall, 53 percent of students met English proficiency and 44 percent met math proficiency.
While on the School Dashboard the district’s average displays students in the “green” rating for English proficiency, or meeting proficiency standards, the district’s Hispanic, homeless, and otherwise socioeconomically disadvantaged students are in the “yellow” category, meaning they “did not meet” or “almost met” standards.
Hispanic students’ scores increased by 5.6 points in English, but still fell 33 points short of proficiency. Socioeconomically disadvantaged students’ scores increased by 7.1 points, but remained 30.8 points below proficiency standards.
By comparison, the district’s white students are in the highest “blue” category, sitting 64.3 points above proficiency standards, increasing 5.9 points from last year.
Long-term English learners’ results declined by 6 points, putting them in the lowest “red” category, 114.6 points below proficiency.
English learners and students with disabilities maintained scores from last year and increased by 6.7 points, respectively. They are in the second-lowest “orange” category, with English learners 67.2 points below proficiency and students with disabilities 89.3 points below proficiency.
Math is a similar picture across demographics, with Hispanic students 64.2 points below proficient (yellow), a 3.5 point gain. White students were 48 points above proficient (blue), a 7.8 point gain.
Individually, most SBUSD schools saw gains in proficiency or maintained scores from last year. Some saw vast improvements in English and math proficiency.
Alta Vista Alternative High School, for example, saw student proficiency improve by 80.8 points in English and 29.5 points in math.
Santa Barbara Community Academy saw gains of 25.9 points in English, and 16.4 points in math.
Harding University Partnership School saw improvements of 8.8 points in English and 17.5 points in math.
Roosevelt Elementary scores increased by 16.2 points in English and 13.1 points in math.
Other schools saw declines.
Adams Elementary saw declines by 18.6 percent in English and 6.1 points in math. McKinley Elementary maintained rates in English but declined 9.3 points in math. Santa Barbara Charter School declined 9.6 points in English and 5.4 points in math.
Still, the district emphasized that it exceeded the goals set in its three-year Local Control and Accountability Plan, or LCAP, that ends this school year.
LCAP goals included reaching one point above the standard in English and 30 points below it in math, the district said.
“Santa Barbara Unified finished above both targets,” it said.
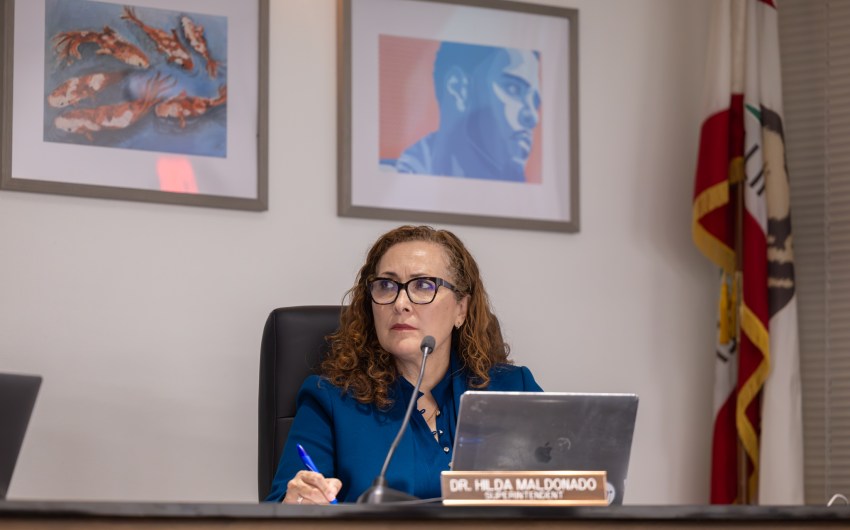
“We set these goals because we want to see our commitments translate into stronger outcomes for students,” Superintendent Hilda Maldonado said in a statement.
“Exceeding our goals in literacy and math is an important step,” she said. “Now we need to build on that progress and make sure it reaches students who are still struggling.”
District initiatives include universal literacy screenings, professional development, and targeted interventions for students.
“Behind these results are students working hard and educators thinking carefully about what each child needs to succeed,” Maldonado said. “Educators and staff have been analyzing student performance metrics and applying proven instructional strategies to cultivate vibrant, welcoming spaces that inspire a passion for discovery across every classroom.”
On a broader scale, California celebrated meager progress over the 2025-26 school year, including for Hispanic/Latino students who “demonstrated larger-than-average improvements in ELA and mathematics and positive mathematics score trends across all grades,” the California Department of Education said in a press release.
Statewide, English proficiency rose 0.5 percent and math rose 1.1 percent, amid declining enrollment and a rising population of students with disabilities, according to school dashboard data.
“California has made important strides in expanding student supports and opportunities, but the pace of academic improvement reminds us that our work is far from finished,” State Superintendent Tony Thurmond said in a statement.
While Thurmond and Governor Gavin Newsom took an optimistic view on California’s progress, others critiqued it as incremental, comparing the state to others that have decidedly fewer resources but better student outcomes. Advocates are calling on the state to address uneven outcomes and strengthen leadership to address the state’s cycle of minimal improvement.
Related Posts
Premier Events
Fri, Oct 23
2:00 PM
Santa Barbara
Music & Meditation: Clarinetist Nancy Mathison & Pianist Antonio Artese

Thu, Oct 22
5:30 PM
Santa Barbara
Best Fest: A Celebration of the Best of Santa Barbara® Readers’ Poll 2026 – Rain or Shine

Thu, Oct 22
6:00 PM
Santa Barbara
Chaucer’s Books Author Talk & Signing- Daniel M. Jaffe “Russian Silhouette: A Memoir of Activism and Identity”

Fri, Oct 23
5:30 PM
Solvang
Solvang Haunted House and Street Fair
Fri, Oct 23
7:00 PM
Santa Barbara
Beth Amine’s 20th Anniversary Wildcat Dance Variety Show
Fri, Oct 23
7:00 PM
Santa Barbara
This & That Performs at Roy

Fri, Oct 23
9:00 PM
Santa Barbara
Casa de la Raza Fundraiser: Brasscals! with DJ Darla Bea
Sat, Oct 24
10:30 AM
Santa Barbara
Picnic in the Cemetery: A Live Historical Event
Sat, Oct 24
11:00 AM
Goleta
2nd Annual Charger Cup to Benefit DP High Golfers

Sat, Oct 24
12:00 PM
Santa Barbara
Makers Hive Market
Sat, Oct 24
2:00 PM
Santa Barbara
Japanese Sacred Architecture: Shinto and Buddhism
Fri, Oct 23 2:00 PM
Santa Barbara
Music & Meditation: Clarinetist Nancy Mathison & Pianist Antonio Artese
Thu, Oct 22 5:30 PM
Santa Barbara
Best Fest: A Celebration of the Best of Santa Barbara® Readers’ Poll 2026 – Rain or Shine
Thu, Oct 22 6:00 PM
Santa Barbara
Chaucer’s Books Author Talk & Signing- Daniel M. Jaffe “Russian Silhouette: A Memoir of Activism and Identity”
Fri, Oct 23 5:30 PM
Solvang
Solvang Haunted House and Street Fair
Fri, Oct 23 7:00 PM
Santa Barbara
Beth Amine’s 20th Anniversary Wildcat Dance Variety Show
Fri, Oct 23 7:00 PM
Santa Barbara
This & That Performs at Roy
Fri, Oct 23 9:00 PM
Santa Barbara
Casa de la Raza Fundraiser: Brasscals! with DJ Darla Bea
Sat, Oct 24 10:30 AM
Santa Barbara
Picnic in the Cemetery: A Live Historical Event
Sat, Oct 24 11:00 AM
Goleta
2nd Annual Charger Cup to Benefit DP High Golfers
Sat, Oct 24 12:00 PM
Santa Barbara
Makers Hive Market
Sat, Oct 24 2:00 PM
Santa Barbara