
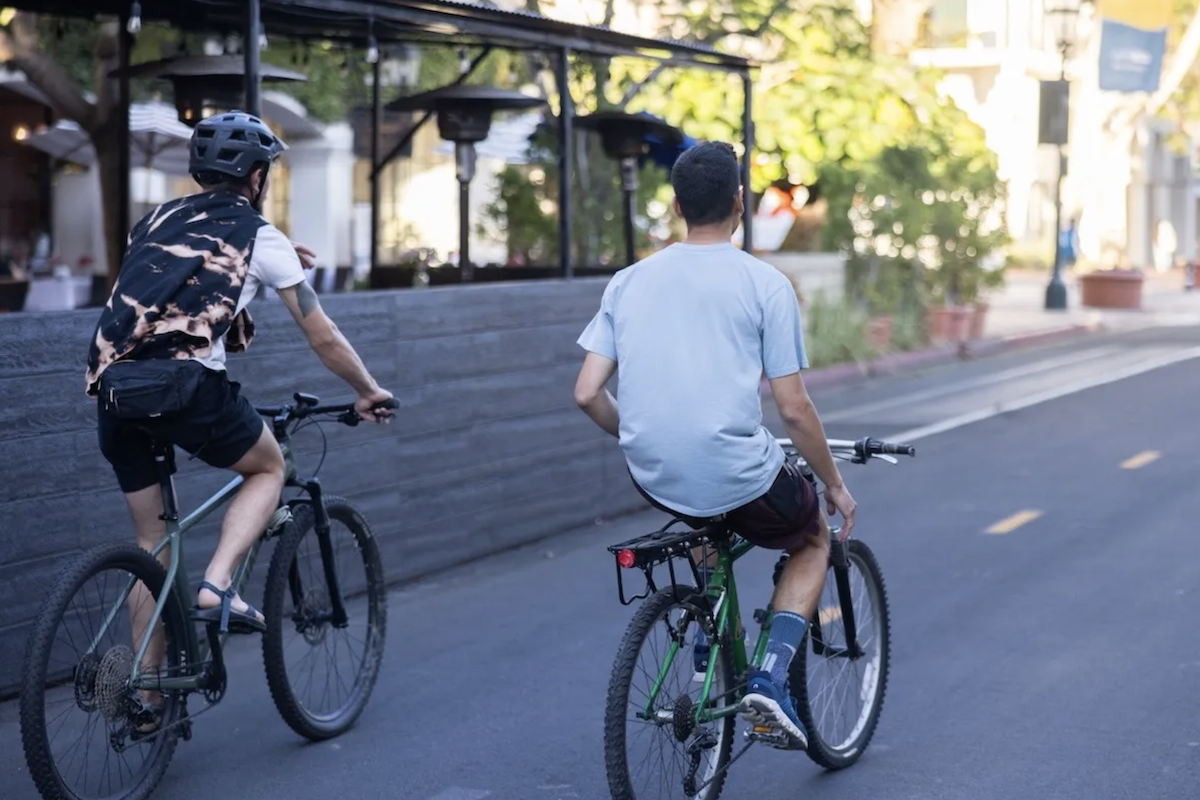
The last bike map for Santa Barbara County was published in 2013. A lot’s changed in the 12 years since, not the least of which being the massive technological opportunities offered by computers and social media. But in addition, there’s been a significant proliferation of bike lanes and bike paths and what’s known as road infrastructure designed to make cyclists feel more safe and more comfortable. Thanks to a half-million-dollar state grant, a new app-accessible map of Santa Barbara County’s bikeways — aided by the double-edged sword of AI technology — is in the offing.
Fueled by the seemingly subliminal agenda of “If you map it, they might ride more,” the new project — a joint project between UCSB, the Santa Barbara County Association of Governments (SBCAG), and the Simon Fraser University in Canada — hopes to fold in metrics showing which routes are more comfortable to the riders. The shortest line between Points A and B is not always the safest or most comfortable, especially when the pushing of pedals is involved. Hills, road conditions, levels of congestion, and visibility are all factors that enter the equation.
The trick here is how to arrive at an interchangeable, comparative metric for something so inherently subjective in nature. To do this, SBCAG is beating the bushes for 12 volunteers to populate a new AI Bike Map Ad Hoc Working Group — or AIBMAHWG — to help evaluate and rank stretches of roadway on a scale of 1-5 along a gradient of low, medium, and high comfort levels.
According to Lauren Bianchi Klemann of SBCAG, the hope is to get a diverse cross section of the community from expert riders to novices. The time demands are relatively light — just three hours a quarter.
Really leading the way on this is UCSB Geography Professor Trisalyn Nelson, an avid bike rider and scholar of computerized bike apps and mapping methods. Nelson has already launched an interactive, crowd-sourced bike mapping effort for the South Coast with Bikemaps.org, which shows areas of high concentration for bicycle collisions and close calls. Linked to these red dots are short descriptions of what happened — a bike rider runs a stop sign and is sent to ER. Using AI, this data will be folded into the new bike map app initiative — officially dubbed the Biking Mapping and Wayfinding Project — as well as the comfort readings.
Nelson — born in Canada — helped pioneer the comfort metrics while teaching at Simon Fraser University in Canada. Typically “high” comfort readings there denoted segregated bike paths or local street bikeways, “medium” denoted multi-use paths, and “low” denoted painted bike lanes.
According to Nelson, the new map will use open street map data, a training data set available from Google’s street view, and the comfort classification data based on the presence or absence of bicycle street infrastructure. Since that infrastructure is shifting so rapidly, with new lanes being set aside with various impacts, that data would be folded into the map about once a year with the help of AI.
If all goes according to plan, the new map should be ready to roll next summer.
The deadline to apply for the AI Bike Map Ad Hoc Working Group is 5 p.m. on Tuesday, August 12. To learn more about the project or to apply to be in the working group, visit http://www.sbcag.org/project/AIbikemap.
Related Posts


Premier Events

Sun, Jun 07
All day
Santa Barbara
SEIMANDI & LEPRIEUR – Hunt Slonem Exhibition Now – June 7

Sun, May 31
1:00 PM
Santa Barbara
Courtyard by Marriott Santa Barbara Presents Sunday Soundwaves
Sun, May 31
6:00 PM
Santa Barbara, CA
Blue Full Moon Ceremony
Sun, May 31
7:30 PM
Santa Barbara
Herman Matthews Presents: Phatback, Earl & Me! SOhO

Tue, Jun 02
5:00 PM
Santa Barbara
UCSB Media Arts & Technology End of Year Show (EoYS): “re:agency”

Tue, Jun 02
7:30 PM
Santa Barbra
Adelfos Ensemble presents: Enlightened Harmonies

Wed, Jun 03
11:40 AM
Santa Barbara
Women’s Prosperity Partners S.B. LEADS Club Virtual Meeting- Female Entrepreneurs

Wed, Jun 03
6:00 PM
Santa Barbara
Chaucer’s Book Talk – Greg Orfalea
Wed, Jun 03
6:00 PM
Santa Barbara
Bingo for Bottles at Carr Winery

Wed, Jun 03
7:30 PM
Santa Barbara
Ensemble Theatre Company Presents “Every Brilliant Thing”

Thu, Jun 04
5:00 PM
Santa Barbara
LGBTQIA+ Pride Artist Showcase
Sun, Jun 07 All day
Santa Barbara
SEIMANDI & LEPRIEUR – Hunt Slonem Exhibition Now – June 7
Sun, May 31 1:00 PM
Santa Barbara
Courtyard by Marriott Santa Barbara Presents Sunday Soundwaves
Sun, May 31 6:00 PM
Santa Barbara, CA
Blue Full Moon Ceremony
Sun, May 31 7:30 PM
Santa Barbara
Herman Matthews Presents: Phatback, Earl & Me! SOhO
Tue, Jun 02 5:00 PM
Santa Barbara
UCSB Media Arts & Technology End of Year Show (EoYS): “re:agency”
Tue, Jun 02 7:30 PM
Santa Barbra
Adelfos Ensemble presents: Enlightened Harmonies
Wed, Jun 03 11:40 AM
Santa Barbara
Women’s Prosperity Partners S.B. LEADS Club Virtual Meeting- Female Entrepreneurs
Wed, Jun 03 6:00 PM
Santa Barbara
Chaucer’s Book Talk – Greg Orfalea
Wed, Jun 03 6:00 PM
Santa Barbara
Bingo for Bottles at Carr Winery
Wed, Jun 03 7:30 PM
Santa Barbara
Ensemble Theatre Company Presents “Every Brilliant Thing”
Thu, Jun 04 5:00 PM
Santa Barbara
